
How to Identify and Eliminate Waste in Your Factory
Most manufacturing problems are not caused by a single broken machine or a single bad decision. They are caused by an invisible system of delays, handoffs, overproduction, and waiting that nobody has ever drawn on a single page.
Value Stream Mapping (VSM) makes that invisible system visible. It is one of the most powerful tools in lean manufacturing, and one of the most underused, not because it is complex, but because it requires going to the floor, observing honestly, and accepting that reality is probably very different from the procedure manual.
What Is Value Stream Mapping?
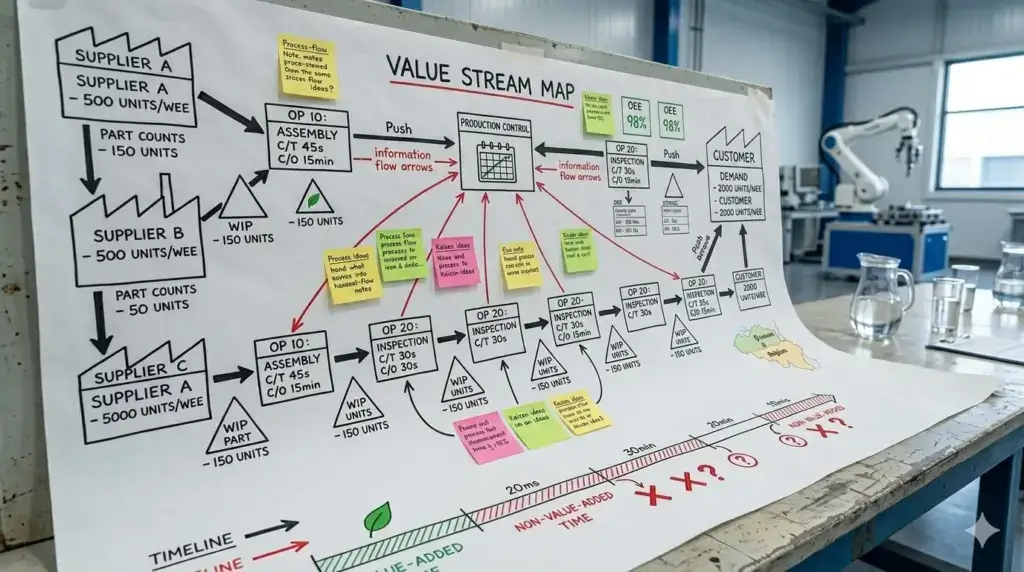
Value Stream Mapping is a lean tool used to visualize the complete flow of materials and information required to deliver a product to a customer, from raw material to finished goods.
Two maps are always created: the Current State Map (what actually happens today) and the Future State Map (what the process should look like after waste is removed). The gap between the two becomes your roadmap for improvement.
The 8 Wastes VSM Helps You Identify
| Waste | What it looks like on a VSM |
| Defects | Rework loops, scrap buffers |
| Overproduction | Large inventory triangles between steps |
| Waiting | Long lead times, queue times between processes |
| Non-utilized talent | Steps requiring skilled workers for simple tasks |
| Transportation | Long arrows between distant processes |
| Inventory | Inventory triangles with high part counts |
| Motion | Multiple sub-steps within a process box |
| Extra processing | Steps that add no customer value |
Tools You Need to Create a VSM
- A large roll of paper or whiteboard — at least A0 size
- Pencils and markers — use pencil first, ink later
- Standard VSM icons — printed on a reference card
- A stopwatch — for measuring cycle times and changeover times
- A clipboard — for collecting data on the floor
- A camera or phone — to document the current state
How to Map Your Current State
Step 1 — Choose your product family:
VSM is drawn for a specific product or product family that shares similar process steps. Do not try to map your entire factory at once.
Step 2 — Start with the customer:
Draw the customer box in the top-right corner. Note their demand rate and delivery requirements.
Step 3 — Map the supplier:
Draw the supplier box in the top-left. Note the frequency of incoming material and batch sizes.
Step 4 — Walk the process backwards:
Start at the shipping dock and walk upstream to raw material storage. Draw each process step as a box. Collect data at each step: cycle time, changeover time, uptime, and number of operators.
Step 5 — Add inventory triangles:
Between each process step, draw a triangle representing the inventory that sits there. Note the quantity and days of supply.
Step 6 — Add information flows:
Draw how production orders, schedules, and customer demand signals flow.
Step 7 — Calculate the timeline:
At the bottom of the map, alternate between value-adding time and non-value-adding time. A typical plant has a value-added ratio of 5% to 15%.
Designing the Future State Map
Use these seven questions to guide your future state design:
1. What is the customer takt time? (takt time = available production time divided by customer demand)
2. Will you build to a finished goods supermarket or directly to shipping?
3. Where can you create continuous flow?
4. Where do you need a pull system with a supermarket?
5. What is the single scheduling point (the pacemaker process)?
6. How will you level the production mix at the pacemaker?
7. What process improvements are required to achieve the future state?
Building Your VSM Action Plan
List each improvement required to reach the future state.
Assign an owner and a deadline to each item.
Group improvements into short-term (0-3 months), medium-term (3-6 months), and long-term (6-12 months).
Define the KPI that will confirm each improvement is achieved.
VSM in Digital vs. Paper Format
Paper VSM is best suited for the initial floor-mapping exercise. It encourages team participation and is easy to modify in real time.
Digital VSM is best for sharing with management and updating over time. Lucidchart, Miro, and eVSM are popular options.
The rule: observe on paper, document digitally.
Conclusion
A well-executed VSM exercise typically reveals that 60% to 90% of your total lead time is pure waste, and that most of it can be eliminated without capital investment by simply redesigning flow and pull systems.
- Start with one product family.
- Map the current state in one day.
- Design the future state in the next.
- Then execute.