
Introduction
Most manufacturing plants are operating at a fraction of their actual capacity without realizing it. Not because of a lack of machines or people, but because of hidden losses that accumulate silently every shift: unplanned downtime, slow cycles, minor stoppages, and defects.
Overall Equipment Effectiveness (OEE) is the single most powerful metric for making these losses visible and actionable.
What Is OEE and Why It Matters
OEE is a standardized metric that measures how effectively a manufacturing operation is utilized. It combines three factors: Availability, Performance, and Quality, into a single percentage that represents the proportion of planned production time that is truly productive.
A world-class OEE score is 85% or above. Most manufacturing plants operate between 40% and 60%, meaning there is enormous hidden capacity waiting to be unlocked.
The Three OEE Components
Availability:
Measures the percentage of scheduled time that the equipment is available to operate. Losses include unplanned downtime (breakdowns) and planned downtime (changeovers, maintenance).
Formula: Availability = Run Time / Planned Production Time
Performance:
Measures how fast the equipment runs compared to its designed speed. Losses include slow cycles and minor stoppages.
Formula: Performance = (Ideal Cycle Time x Total Count) / Run Time
Quality:
Measures the proportion of good parts produced out of total parts started. Losses include defects, rework, and startup scrap.
Formula: Quality = Good Count / Total Count
How to Calculate Your OEE Score
OEE = Availability x Performance x Quality
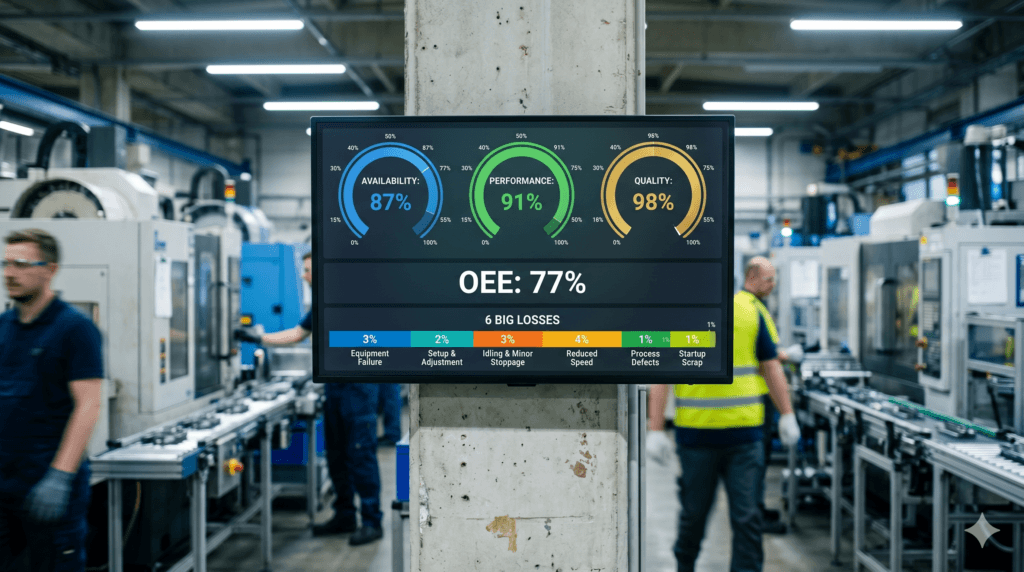
Example: A machine is scheduled for 8 hours (480 minutes). It has 60 minutes of downtime (Availability = 87.5%). It runs at 90% of its ideal speed (Performance = 90%). Of the parts produced, 98% pass quality inspection (Quality = 98%).
OEE = 87.5% x 90% x 98% = 77.2%
This means only 77.2% of planned production time is truly productive. The remaining 22.8% is hidden loss.
What Is a Good OEE Benchmark?
| OEE Score | Interpretation |
| < 65% | Significant improvement needed — major losses present |
| 65% – 75% | Average — typical of many manufacturing plants |
| 75% – 85% | Good — above average, improvement program in place |
| > 85% | World class — benchmark for best-in-class manufacturers |
The 6 Big Losses That Reduce OEE
Availability losses:
- Equipment failures (breakdowns)
- Set up and adjustment (changeovers).
Performance losses:
- Idling and minor stoppages (jams, sensor faults)
- Reduced speed (running below ideal cycle time)
Quality losses:
- Process defects (scrap and rework during stable production)
- Reduced yield (startup scrap until process stabilizes)
How to Improve OEE Step by Step
Step 1 – Measure accurately:
You cannot improve what you do not measure. Start with a 2-4 week data collection period to establish your baseline OEE.
Step 2 – Identify your biggest loss:
Use Pareto analysis of the 6 Big Losses to find where the most time is being lost.
Step 3 – Attack the top loss with a structured improvement:
Use TPM (Total Productive Maintenance) for equipment failures, SMED for changeover time, and Poka-Yoke for quality losses.
Step 4 – Implement daily OEE review:
Make OEE visible on the shop floor. Review it daily in team meetings. React to deviations in real time.
Step 5 – Sustain with standards:
Document improvements, update PM schedules, train operators, and build OEE targets into your production KPIs.
OEE Tools and Digital Dashboards
Manual OEE: Operators record downtime reasons, quantities, and quality results on paper or simple spreadsheets. Low cost but prone to recording delays and errors.
Digital OEE: MES (Manufacturing Execution Systems) such as Aveva, Tulip, or Inductive Automation Ignition collect OEE data automatically from sensors or operator touchscreens. Real-time visibility enables immediate response.
Conclusion
OEE is not just a number. It is a window into every minute of production time your plant is losing. Once you can see the losses clearly, improving them becomes straightforward.
Start with an honest baseline measurement. Find your biggest loss. Fix it. Then measure again.